


Customer Acquisition Cost in B2B: The K-ACE Method for Variable Pricing

Same industry, same product, same market: CAC can still swing 16x from one customer to the next. That isn't a measurement error. It's what happens when pricing itself is never one number — which is exactly why CAC shouldn't be treated as one, either.
In one line: in B2B, Customer Acquisition Cost is a distribution, not a single figure, because pricing isn't single either — it moves by channel, by motion (self-serve versus sales-led), by tier, by deal size. Treating it as an average buries the one piece of information you actually needed to decide where to invest. The K-ACE method — Know, Allocate, Compare, Estimate — exists to simulate CAC across those scenarios instead of photographing it once. Krein is building that into a tool, K-AC, currently in refinement.
A budget cleared by the board. A CFO asking the spend to be justified. A channel plan promising results by end of quarter. Every B2B funnel starts from an implicit number: what the next customer will actually cost. The problem is that the textbook formula — marketing and sales spend divided by new customers won in the period — produces an average that flattens a reality far messier than the number suggests.
Why CAC needs to be known before you start, not after
Calculating CAC after the fact is bookkeeping. Calculating it before launching an acquisition strategy is a strategic decision — and the gap between those two moments is usually the gap between a budget that holds and one that gets rebuilt mid-year.
The reasons are structural, not anecdotal. Research by Frederick Reichheld for Bain & Company — revisited by Harvard Business Review in 2014 and still one of the most cited references on the topic — found that acquiring a new customer costs 5 to 25 times more than retaining an existing one, and a 5% lift in retention can raise profits by 25% to 95%. If CAC isn't estimated with a method before budget gets allocated, the risk isn't overspending. It's spending in the wrong direction, quietly, for an entire quarter before the actuals catch up.
There's a governance reason too. In B2B, increasingly, CAC isn't a marketing KPI, it's a line the CFO reads before signing off. A CAC estimated through a method, not a gut-feel range, is the only way to bring that conversation numbers that hold up under scrutiny, instead of an intuition defended out loud in a room.
Same market, opposite numbers: what the 2026 benchmarks say
This is where data does more work than definitions. In B2B SaaS, median self-serve CAC sits around $702, against $11,400 for enterprise sales-led acquisition, roughly a 16x gap, the widest industry analysis based on Benchmarkit data has recorded. It isn't an anomaly. It simply reflects two different go-to-market motions, with entirely different sales cycles, stakeholder counts and commercial labour cost attached to the same product.
CAC payback follows the same scenario logic, not a single average. Bessemer Venture Partners — one of the funds that has done the most to standardise how investors read B2B growth efficiency — publishes benchmarks split by segment:
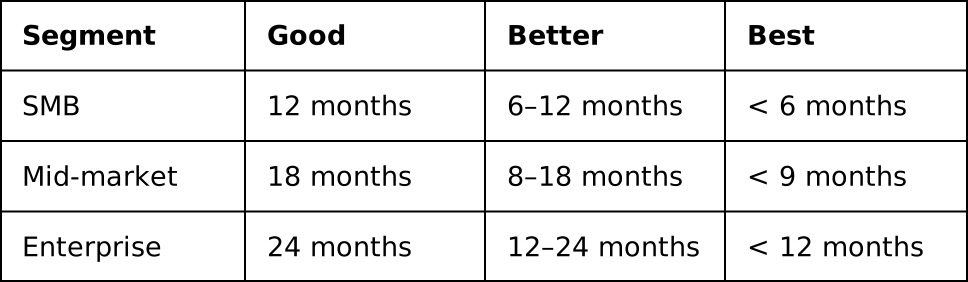
The Aleph × Benchmarkit 2026 report, drawn from 342 SaaS and AI-native companies, confirms the picture on the ground: a median payback of 16 months, with the top quartile recovering CAC in 6 months or less and the bottom quartile past 24. Between those two extremes there is no "average" company; there's an entire spectrum of pricing, channel and motion scenarios that one single industry runs through at the same time.
The time side of CAC has moved too. According to Bain & Company's B2B Sales Benchmarks 2026, enterprise sales cycles have stretched by 23 days and mid-market cycles by 14 days versus 2023 — and because commercial cost accrues for every day a deal sits in pipeline, cutting cycle length by 10% is mathematically equivalent to cutting CAC by roughly 7–9%. Time, in other words, is already an implicit pricing lever: close faster, and closing costs less.
Then there's the most direct lever of all: price itself. In the McKinsey study of more than 2,400 companies published by Harvard Business Review ("Managing Price, Gaining Profit," Marn and Rosiello, 1992) — still the most-cited academic reference on the subject — a 1% price increase, assuming stable volumes, produces an 11.1% increase in operating profit, against 7.8% for an equivalent cut in variable costs and 3.3% for an equivalent rise in volume. No channel optimization gets anywhere near that order of magnitude. Which leads straight to the next point: if price carries that much weight in the outcome, CAC cannot be calculated while ignoring that price, in B2B, is never a fixed number.
When authoritative B2B companies re-read their own CAC
The aggregate data gets more concrete when you look at it through documented cases.
HubSpot has published its own State of Marketing/Inbound Report since 2009, and the finding has stayed remarkably stable over time: organizations with an inbound-led motion report a cost per lead roughly 61% lower than outbound-led ones. It is a longitudinal series that HubSpot itself, a company that lives and dies by efficient CAC, has kept measuring and publishing for over a decade, precisely because acquisition channel remains one of the most determinant variables of final CAC, holding product and market constant.
OpenView Partners, among the funds that have done the most to standardize product-led growth benchmarking in B2B software, consistently observes across its datasets that product-led motions land a CAC 30-50% lower than sales-led ones, because part of the buying journey happens in self-service, before a rep ever enters the picture, shifting some of the cost from sales to product itself.
Finally, the variable-pricing angle: Metronome's 2025 State of Usage-Based Pricing Report found that consumption-based models produce 22% lower churn than flat-rate pricing. An apparently identical CAC, spent to acquire two customers under two different pricing models, ends up producing a very different economic return over time, which is, ultimately, the reason a good B2B CAC is never evaluated on its own, but always alongside the pricing that generated it.
Why variable pricing complicates — and enriches — the CAC calculation
The thread running through these cases is the same one that makes every "average CAC" fragile: in B2B, pricing is almost never a single number. According to a 2025 industry survey cited by CRV, 85% of SaaS companies have already adopted or are adopting a consumption-based pricing model, often layered on top of fixed tiers and custom enterprise pricing. Every tier attracts a different customer profile, with a different acquisition channel, a different sales cycle and, as a result, a different CAC.
Calculating a single CAC across a multi-tier pricing structure is a bit like measuring a room's average temperature with the radiator blasting on one side and the window open on the other: the number exists, but it doesn't describe any real point in the room. The problem isn't (only) arithmetic. It's a framework problem: you need a method that treats CAC as a function of several variables — channel, tier, motion, market — rather than a constant to be photographed once a quarter.
The K-ACE method: four phases for CAC under variable pricing
This is the problem K-ACE was built to solve: a four-phase framework designed to estimate B2B CAC not as a single figure but as a set of comparable scenarios, consistent with pricing that changes by channel and by tier. It's not a coincidence that the name reads like "ace": the point is to hand Marketing and Sales one more card to play, right at the moment CAC stops being a closing number and becomes a variable you build the decision on.
K — Know. Start by mapping real historical CAC, by channel and by segment, and comparing it against the available industry benchmarks (payback, LTV:CAC, CAC by motion). Without an honest baseline — and without separating "blended" CAC from "paid" CAC, which in the 2026 benchmarks differ by 2.4-3.1x — every following phase starts from a number that's already skewed.
A — Allocate. Simulate how budget would behave if redistributed across channels and media mix, accounting for the fact that every channel carries its own cost per lead and its own conversion rate, not one multiplier applied uniformly to all.
C — Compare. Scenarios are placed side by side: same budget, different mixes; or same mix, different budgets. The goal isn't to land on "the" correct CAC, but to make the gap between the worst and the best scenario visible, so the decision gets made with that gap in view instead of a single estimated point.
E — Estimate. This is the phase that answers directly to variable pricing: expected CAC is estimated not against one price, but across multiple pricing configurations (tiers, usage thresholds, volume discounts, custom enterprise deals), returning a CAC per pricing scenario instead of an average CAC that hides the very variability that, as shown above, McKinsey and HBR's research ties to an operating-profit impact of over 11 percentage points for every point of price.
K-AC: the Krein tool behind the method
The K-ACE method is the framework. K-AC is the tool Krein is building to put it into practice: a Customer Acquisition Cost simulator and advertising budget optimizer for B2B, drawing on more than 4,000 industry benchmarks and market data points to map the relationship between budget, media mix and expected outcomes, turning assumptions into comparable scenarios instead of intuitions defended out loud in a meeting.
K-ACE is currently in development. Krein is making it available in early access to teams who want to test it, as part of an advisory engagement. Anyone curious can request a free trial or an assessment through Krein's contact channels. Discover the K-ACE method applied to your own digital strategies and contribute to the refinement of this innovative tool.
Key figures referenced in this piece
1. Median B2B CAC ranges from $702 to $11,400 between self-serve and enterprise sales-led motion (~16x) — Digital Applied, CAC Benchmarks 2026
2. "Good" CAC payback per Bessemer Venture Partners runs 12 months (SMB) to 24 months (enterprise); industry median per Aleph × Benchmarkit 2026 (342 companies) is 16 months
3. B2B sales cycles have stretched 14-23 days since 2023 (Bain & Company B2B Sales Benchmarks 2026, via Digital Applied); a 10% shorter cycle ≈ a 7-9% lower CAC
4. A 1% price increase yields +11.1% operating profit at constant volumes — Marn & Rosiello, Harvard Business Review, 1992
5. A 5% lift in retention yields +25-95% profit; acquiring costs 5-25x more than retaining — Reichheld/Bain, via Harvard Business Review, 2014
6. Inbound generates a cost per lead 61% lower than outbound, a stable finding for over a decade — HubSpot, State of Inbound Marketing
7. 85% of SaaS companies have adopted or are adopting usage-based pricing — CRV, B2B Pricing Models and Strategies
FAQ
What is Customer Acquisition Cost (CAC) in a B2B context?
It's the average marketing and sales spend needed to win one new customer in a given period. In B2B it's more useful to read it as a range of scenarios — by channel, motion and pricing — than as a single number, since the variability between those scenarios can exceed 10x.
Why can the same industry show wildly different CAC figures?
Because different motions (self-serve, sales-led, product-led) and different pricing models (flat, tiered, usage-based) produce very different sales cycles, channels and commercial costs, even for the same product and market.
What is the K-ACE method?
It's the four-phase framework — Know, Allocate, Compare, Estimate — Krein uses to estimate B2B CAC as a set of comparable scenarios instead of a single figure, explicitly accounting for pricing variability.
Is K-AC available yet?
K-AC is currently in refinement. Krein is making it available in early access to teams who want to test it on their own data; it isn't yet a public self-service tool at scale.
Want to model your company's CAC across multiple pricing scenarios? Let's talk about it as part of our B2B Digital Strategy, or request early access to K-AC.